
A large amount of time has passed since my last update, but I have an update to my interactive Warhammer 40K Map.
I worked on the project for several months after my last blog entry, but I began to become disheartened with the sheer amount of data entry I had been doing. I hadn’t really progressed the project towards its intended direction, rather gotten bogged down with making sure I had every single planet, region moon etc. marked down.
Having said that, I had made a few improvements during this time, but it wasn’t until this year where I got back into the swing of things.
At the end of January 2020 I went to a training/networking event in Norwich called codebar. I went to the event wanting to focus on JavaScript, and when the mentor asked why, I mentioned my map project. I hadn’t brought any of my files as I wasn’t planning on working on it.
This sparked my enthusiasm for the map again. Because of that, I have added a few new features and completed the data entry portion of my project.
2018
New Map Tiles
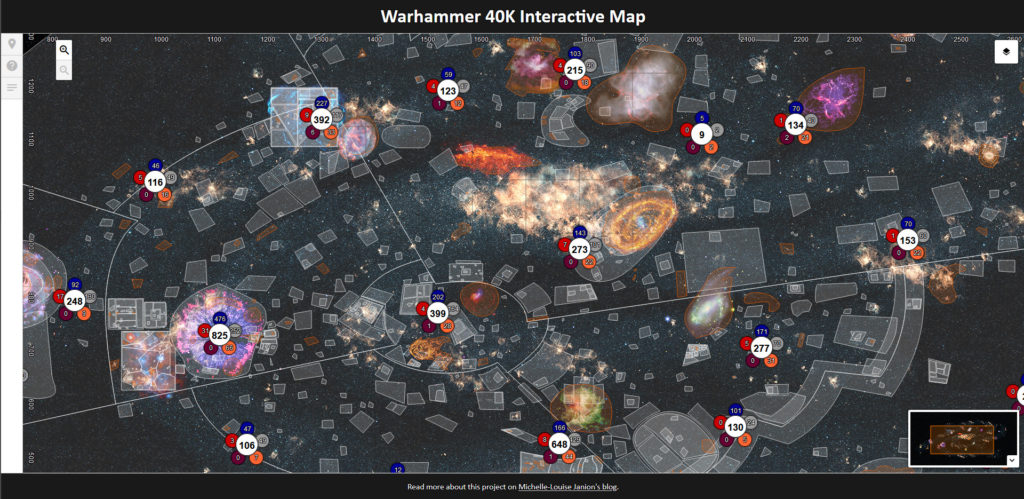
In mid-2018 I made a large visual change to my map and recreated the map tiles.
I had based my original map on one that I had seen on deviantArt (Warhammer 40.000 Galaxy Map by Ikkaan) and so the image I used was the same one used there. This was limiting however, as its dimensions meant that I couldn’t add further zoom levels on to my map without losing image quality.
Starting from scratch, I used images from NASA’s public gallery to create a larger, more detailed map that allowed me room for 9 zoom levels (-4 through to 4).
But the image was huge – I had to save it as .psb files as Photoshop couldn’t cope otherwise. And with the large image size, the time that my image slicing script (the script is available here) took to work through the entire image increased too. I think at the deepest zoom level, the script took about 48 hours to make all the tiles. My poor little PC 🙁
| Zoom level | Tiles |
|---|---|
| -4 | 1 |
| -3 | 2 |
| -2 | 8 |
| -1 | 28 |
| 0 | 91 |
| 1 | 280 |
| 2 | 1035 |
| 3 | 4058 |
| 4 | 16123 |
With the introduction of the new zoom levels, I had a bit more room to play around and so I thought I would incorporate the 5 callout areas for the larger sectors into the map directly. I wasn’t keen on having to move each and every individual marker, and I think this decision was what put me off making more progress so the project stalled at this point.
New Locations
I found a few new sources of region and location data, some of which came from other people who were working on their own projects.
Using this data and cross referencing it against my own, I was able to increase the number of planets, moons, stations etc. to over 5000.
2020
Moving Regions
In 2020 I used a little bit of problem-solving and maths to create another Excel spreadsheet that would help me move the regions and markers to their new positions whilst keeping their original setup.
The Excel tool had three tabs:
- Moving an area and its markers
- Moving and resizing and area and its markers
- Flipping an area and its markers vertically
The tool takes the coordinates of the biggest region in a set, using it as a reference for the markers and other regions inside it. This saved me a lot of time having to remap all of those markers and regions that I wanted to relocate due to the image change.
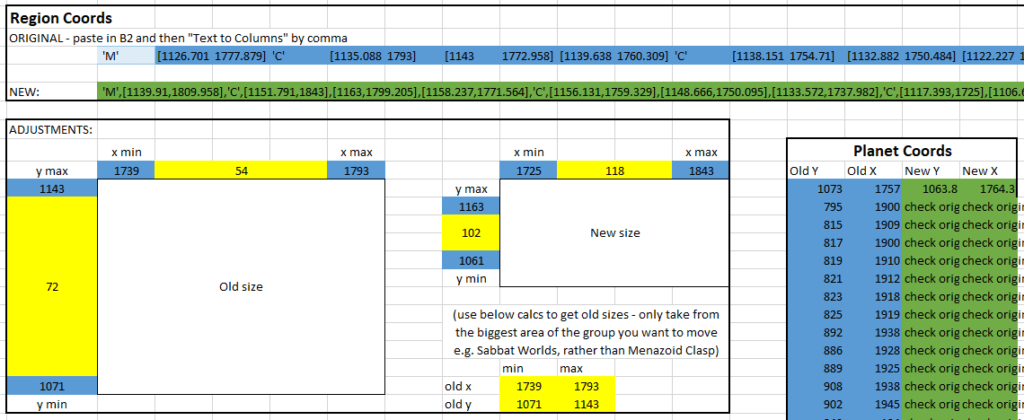
In the image above, blue cells are where you enter your original location details, yellow cells are calculations and green cells are your results.
Sidebar
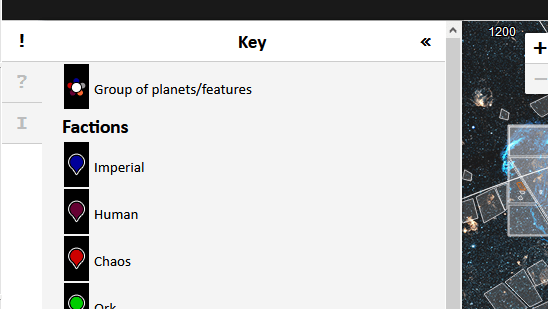
I wanted my map key and information about the project to be more a part of the map rather than below it, so I used a sidebar addon from Turbo87 to do this.
It was nice and easy to set up and I think it really helps to draw attention to this information.
Dynamic Zoom
I noticed with my very wide monitor screen that zooming right out on the map left some gaps where map tiles hadn’t loaded – this was due to the visible area being larger than the map itself.
I had tried correcting this earlier in the project by setting the maximum bounds visible but either this functionality is buggy or I simply misunderstood how it works.
Either way, I came up with a way to dynamically set the minimum zoom level available depending on the dimensions of the browser window. I had already put some functionality to resize the canvas based on the width and height of the browser, I just adapted this to also set the minimum zoom so that none of these missing map tiles would show.
Structured Data
In late 2019 I went on a Search Engine Optimisation course run by Mark Williams-Cook of Candour. This course mentioned that JavaScript wasn’t best friends with Google bot and this got me thinking that I should do something about my map that is entirely JavaScript-based. It wasn’t until my codebar course that I realised a solution (with the help of my tutor) – using structured data to tell Google a bit more information.
{
	"@context": "http://schema.org",
	"@type": "Place",
	"name": "Terra",
	"alternateName": "Earth",
	"containedInPlace": "Sol System » Subsector Solar » Sector Solar » Segmentum Solar » Imperium Dominatus",
	"additionalDetails": [{
		"@type": "PropertyValue",
		"name": "Location Type",
		"value": "Planet"
	}, {
		"@type": "PropertyValue",
		"name": "Location Affiliation",
		"value": "Imperial"
	}, {
		"@type": "PropertyValue",
		"name": "Factions Present",
		"value": "Adeptus Astartes,Adepta Sororitas,Adeptus Custodes,Navis Nobilite"
	}, {
		"@type": "PropertyValue",
		"name": "Climate",
		"value": "Temperate"
	}, {
		"@type": "PropertyValue",
		"name": "Development",
		"value": "Civilised"
	}, {
		"@type": "PropertyValue",
		"name": "Purpose",
		"value": "Adeptus Astartes Homeworld/Recruitment World,Hive,Adepta Sororitas Convent"
	}],
	"subjectOf": {
		"@type": "CreativeWork",
		"name": "Warhammer 40,000",
		"publisher": "Games Workshop"
	}
}
Hopefully that is the correct format for it – I’m still pretty new to structured data.
Edit: It wasn’t correct… but with the help of Google Search Console (albeit, only being informed there was an error) I have managed to fix it and the code above is correct).
Next Steps
One of my next steps is to figure out a fix for the features (orange coloured regions). These are on a layer above other regions (white on the map) and when these are small, they don’t get in the way, but larger areas prevent you from hovering over the areas beneath them.
The main step is to figure out how to add historical data to the map, showing the movements of different fleets or characters over time. I see this working with a slider at the bottom of the map to control the timeline, and then the fleets/characters moving accordingly.
Working Prototype
The working version can be seen in the 40k interactive map v4 directory as well as the main directory.
Previous incarnations can be seen in the version 1, version 2, version 2.1 and version 3 directories.
Not sure this is the place to suggest this but; Inquisitor Corteaz is the Defender of the Formosa Sector (from 40k wiki) and his base of operations is the Nemesis Tessara, Nemesis Subsector (again from the wiki), therefore does it not follow that this part of the Formosa Sector? Just a thought.